

Use all the components of the seamless platform in an exercise
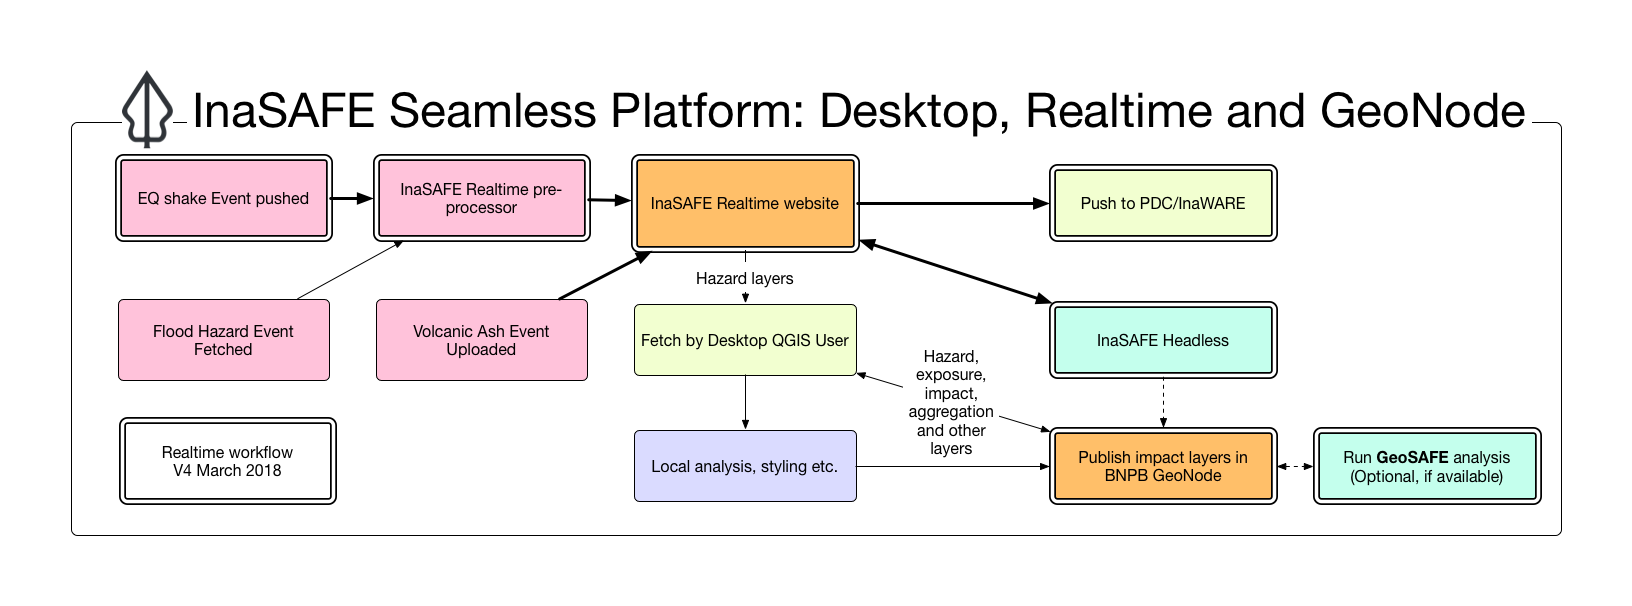
“The seamless platform allows you to find data, perform analysis and share your results in a number of ways”
The Scenario
You are a disaster management officer monitoring InaSAFE Realtime. In the course of a day there is an earthquake, a flood and a volcanic eruption. You fetch the reports from Realtime and act on them but you decide you also want to:
- confirm the analysis results for yourself with some of your own exposure data
- run the analyses on other types of exposure data not available on realtime
- run the analyses with aggregation layers so you can get more granular statistics
- share hazard data, impact layers and exposure data with your colleagues in other departments and in other parts of the country
QGIS, InaSAFE Desktop, InaSAFE Realtime and GeoNode are all available to staff at BNPB and can be used in various ways together to help you be more efficient and effective in your work.
You try:
Goal: Download data, perform analyses and publish and share results for three hazards
Do the tasks in the 'More about' section. You have 2h30 plus a break so there is lots of time.
You will be using many of the skills you have learnt in QGIS, InaSAFE Desktop, InaSAFE Realtime and GeoNode.
We intentionally have not given you every detailed step nor every dataset. This is practice for doing tasks on your own in your day to day work. The instructor will be available to assist but try to get as far as you can by yourself. You are welcome to help each other and discuss and share but you must each do the exercise individually.
The objective is to complete the tasks for all three hazards and have a nice map on GeoNode to show for each one.
More detailed exercise steps
Earthquake
- Choose any earthquake event from the Realtime website. Download the corrected shakemap.
- Earthquake Realtime summarises the impact of an earthquake on people. You want to look at the impact on buildings (structures) by administrative area in InaSAFE Desktop
- prepare the shakemap that you downloaded from Realtime as a hazard layer in QGIS.
- prepare a building exposure layer. Use one from a previous exercise, from your own data, find one online or use the OSM downloader in InaSAFE.
- prepare an aggregation layer e.g. RWs
- Run the analysis. Compare the report with the report on Realtime.
- Upload the MMI layer and the impact layer to GeoNode.
- Give the layers useful names and capture basic metadata.
- Using the social media tools on GeoNode, share your layers with a colleague or friend.
- Style the aggregation layer you used in QGIS and save the style as a default style
- upload the aggregation layer to GeoNode
- Make a Map on GeoNode with your MMI, impact and aggregation layers.
- Add the map as a tile layer to QGIS.
Flood
Fetch flood data from Realtime from an event with more than twenty flooded RWs and follow the same steps as with Earthquake.
Note: When it comes to uploading the flood hazard data to GeoNode, you will have to convert it to shapefile first.
Volcanic Ash
Fetch a volcanic ash hazard model from Realtime and follow the same steps as with Earthquake and Flood.