

Understanding where the data in Realtime comes from and how it can be accessed
“We will review how exposure, aggregation and context data and report templates are sourced and prepared for Realtime and see where to access or maintain them”
Earthquake, Flood and Volcanic Ash are the hazards currently supported by InaSAFE Realtime. By now you know the origin of the the hazard layers used in InaSAFE Realtime analyses.
But to run an InaSAFE impact function we need exposure layers and optionally, aggregation layers. And to generated the maps in the reports we also need some contextual layers. So where do all these layers come from, since we as users are not selecting them like we do in InaSAFE desktop.
These layers are all carefully prepared and stored on the Realtime server. Then they are programmatically added to each headless InaSAFE Realtime analysis and report.
In the previous version of Realtime they were packaged with the software and 'baked in' and it was difficult to change them. In the new version of Realtime they can be modified much more easily, as long as certain conventions are obeyed, such as file names, geometry types and field names.
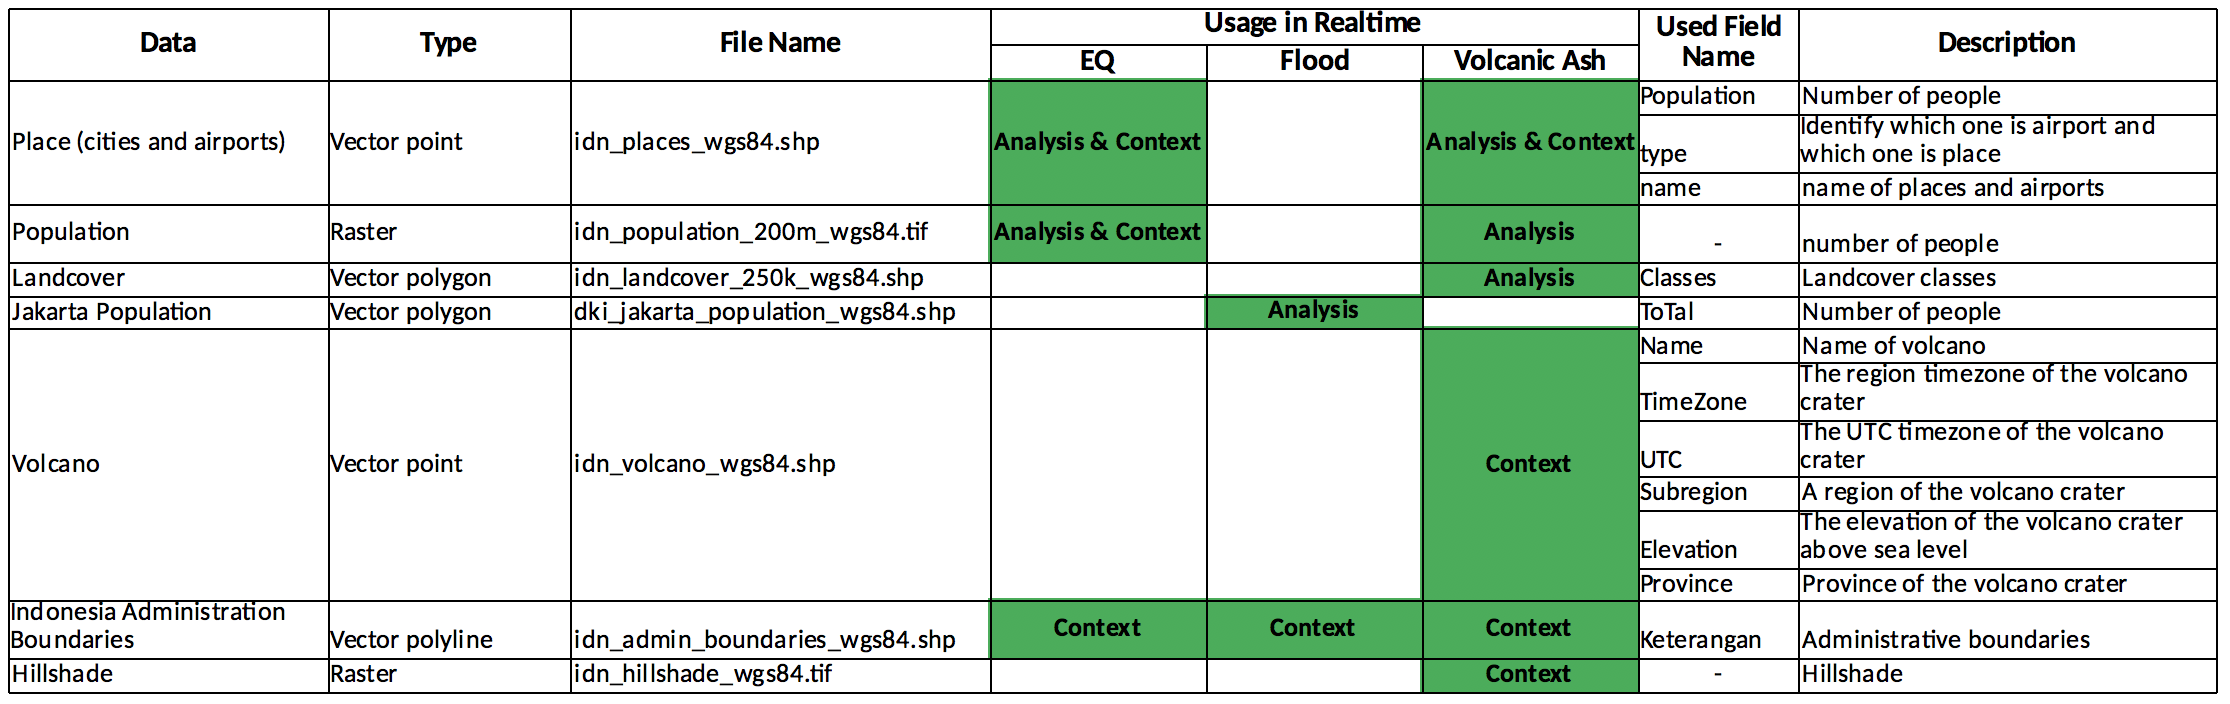
The table below shows the layers currently in use and in which modules they are used and what role they play in each module.
You do not have access to change these layers but it is important that you know where they come from and that they can be changed. The layers will however be published on BNPB GeoNode, which will be covered tomorrow.
You try:
Goal: In this module we aim to understand which other layers Realtime uses and how it uses them
Look at an example of each type of report from Realtime: Earthquake, flood and volcanic ash and write down where each of the layers in the table above is used in that report. Look in the maps, tables and other report elements.
Can you find where each one is used?
Compare and discuss with your neighbour.
More about Realtime data and reports
Each layer used in Realtime is described by a metadata document such as the one to the right, for the Land cover layer. The metadata describes the provenenance and processing history of the data set. Most of the data layers were not simply downloaded from somewhere and used directly. As with Land cover, many of them required skilled and laborious GIS work to prepare.
Another variable component of realtime is the report templates. These are normal QGIS qpt files with layouts and expressions just like those you've been learning about in InaSAFE desktop. So if you notice an error in a report or want to add some more information, for example, you can modify an existing template and replace it. A lot of care needs to be taken to test it before replacing an existing template. As with the various GIS datasets, you do not have access yet to changing the templates but there should be a web interface in Realtime to upload new templates. Only authorised users will be able to do so.


Check your knowledge:
-
Which analysis uses Places point data?:
- earthquake
- flood
- volcanic ash
-
How many different layers had to be combined to create one national land cover layer?:
- none, it was acquired as a complete data set
- six
- three