

Multi-exposure and custom reporting
“The InaSAFE multi-exposure tool supports using more than one exposure dataset with a single hazard.”
In some cases it is interesting to be able to carry out an analysis with a number of different exposure datasets. For example, you may wish to know how many people, buildings and roads might be affected by a flood. InaSAFE provides a tool that lets you carry out such an analysis - and produce a report which combines the results for each exposure. This capability can be used within InaSAFE Desktop and is used by InaSAFE realtime.
InaSAFE Realtime is a web based application that produces reports in near-realtime after a flood in Jakarta or an earthquake in Indonesia. It also supports ad hoc uploading of volcanic ash fall models to produce reports detailing the potential impact of volcanic ash fall.
In this module we will look at the InaSAFE multi-exposure analysis tool and explore some of the options InaSAFE provides for multi-exposure based reporting.
You try:
Goal: To carry out an analysis of flood impact on population and buildings
- Open the project provided with the lesson exercise data.
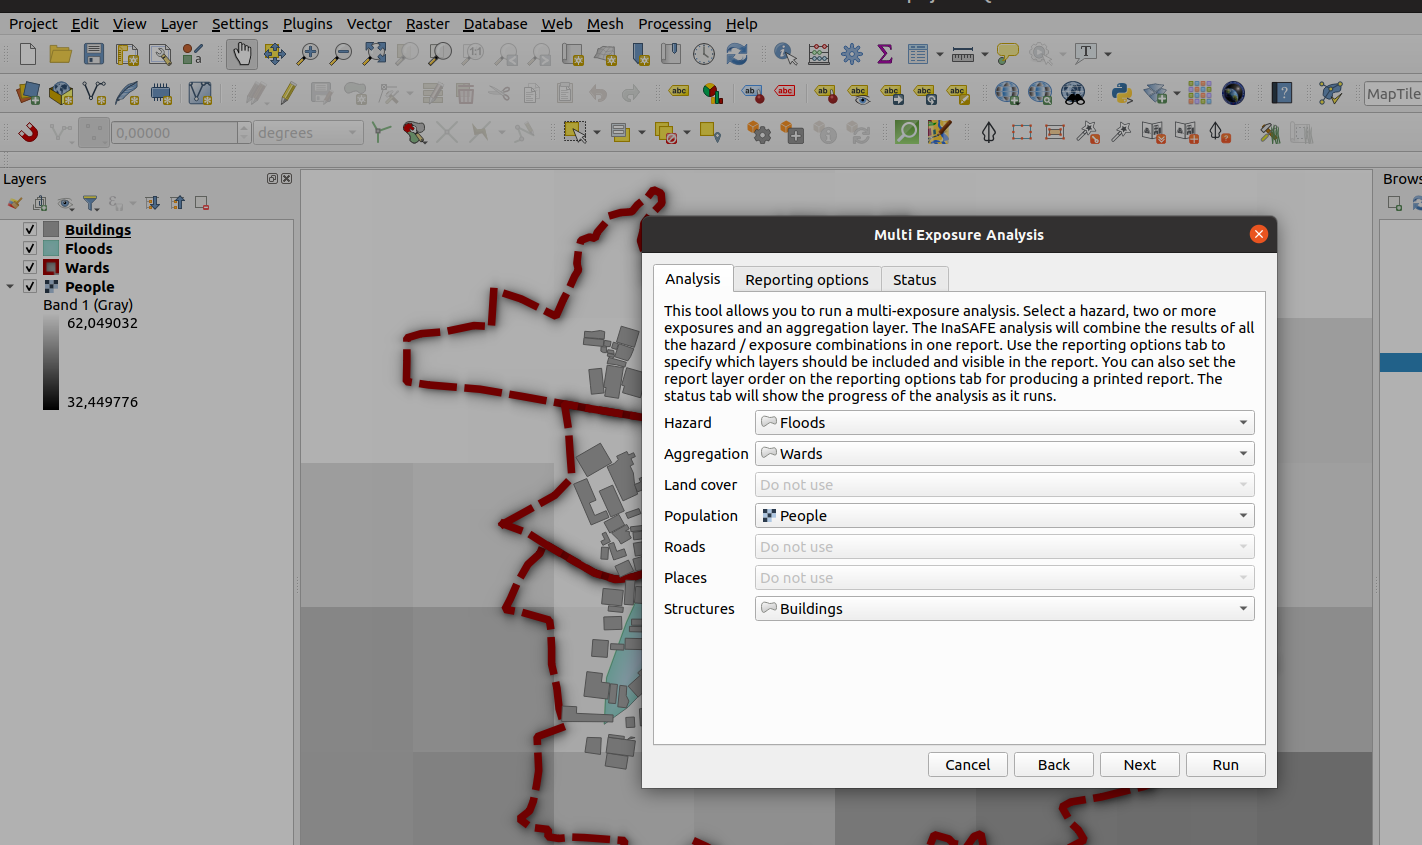
- Use the multi-exposure tool (
Plugins -> InaSAFE -> InaSAFE Multi Exposure Tool) with the options provided in the specification table below - Run the analysis and browse the result products
- Review the contents of the Combined Analysis Summary attribute table
- Ensure the Combined Analysis Summary attribute table is selected
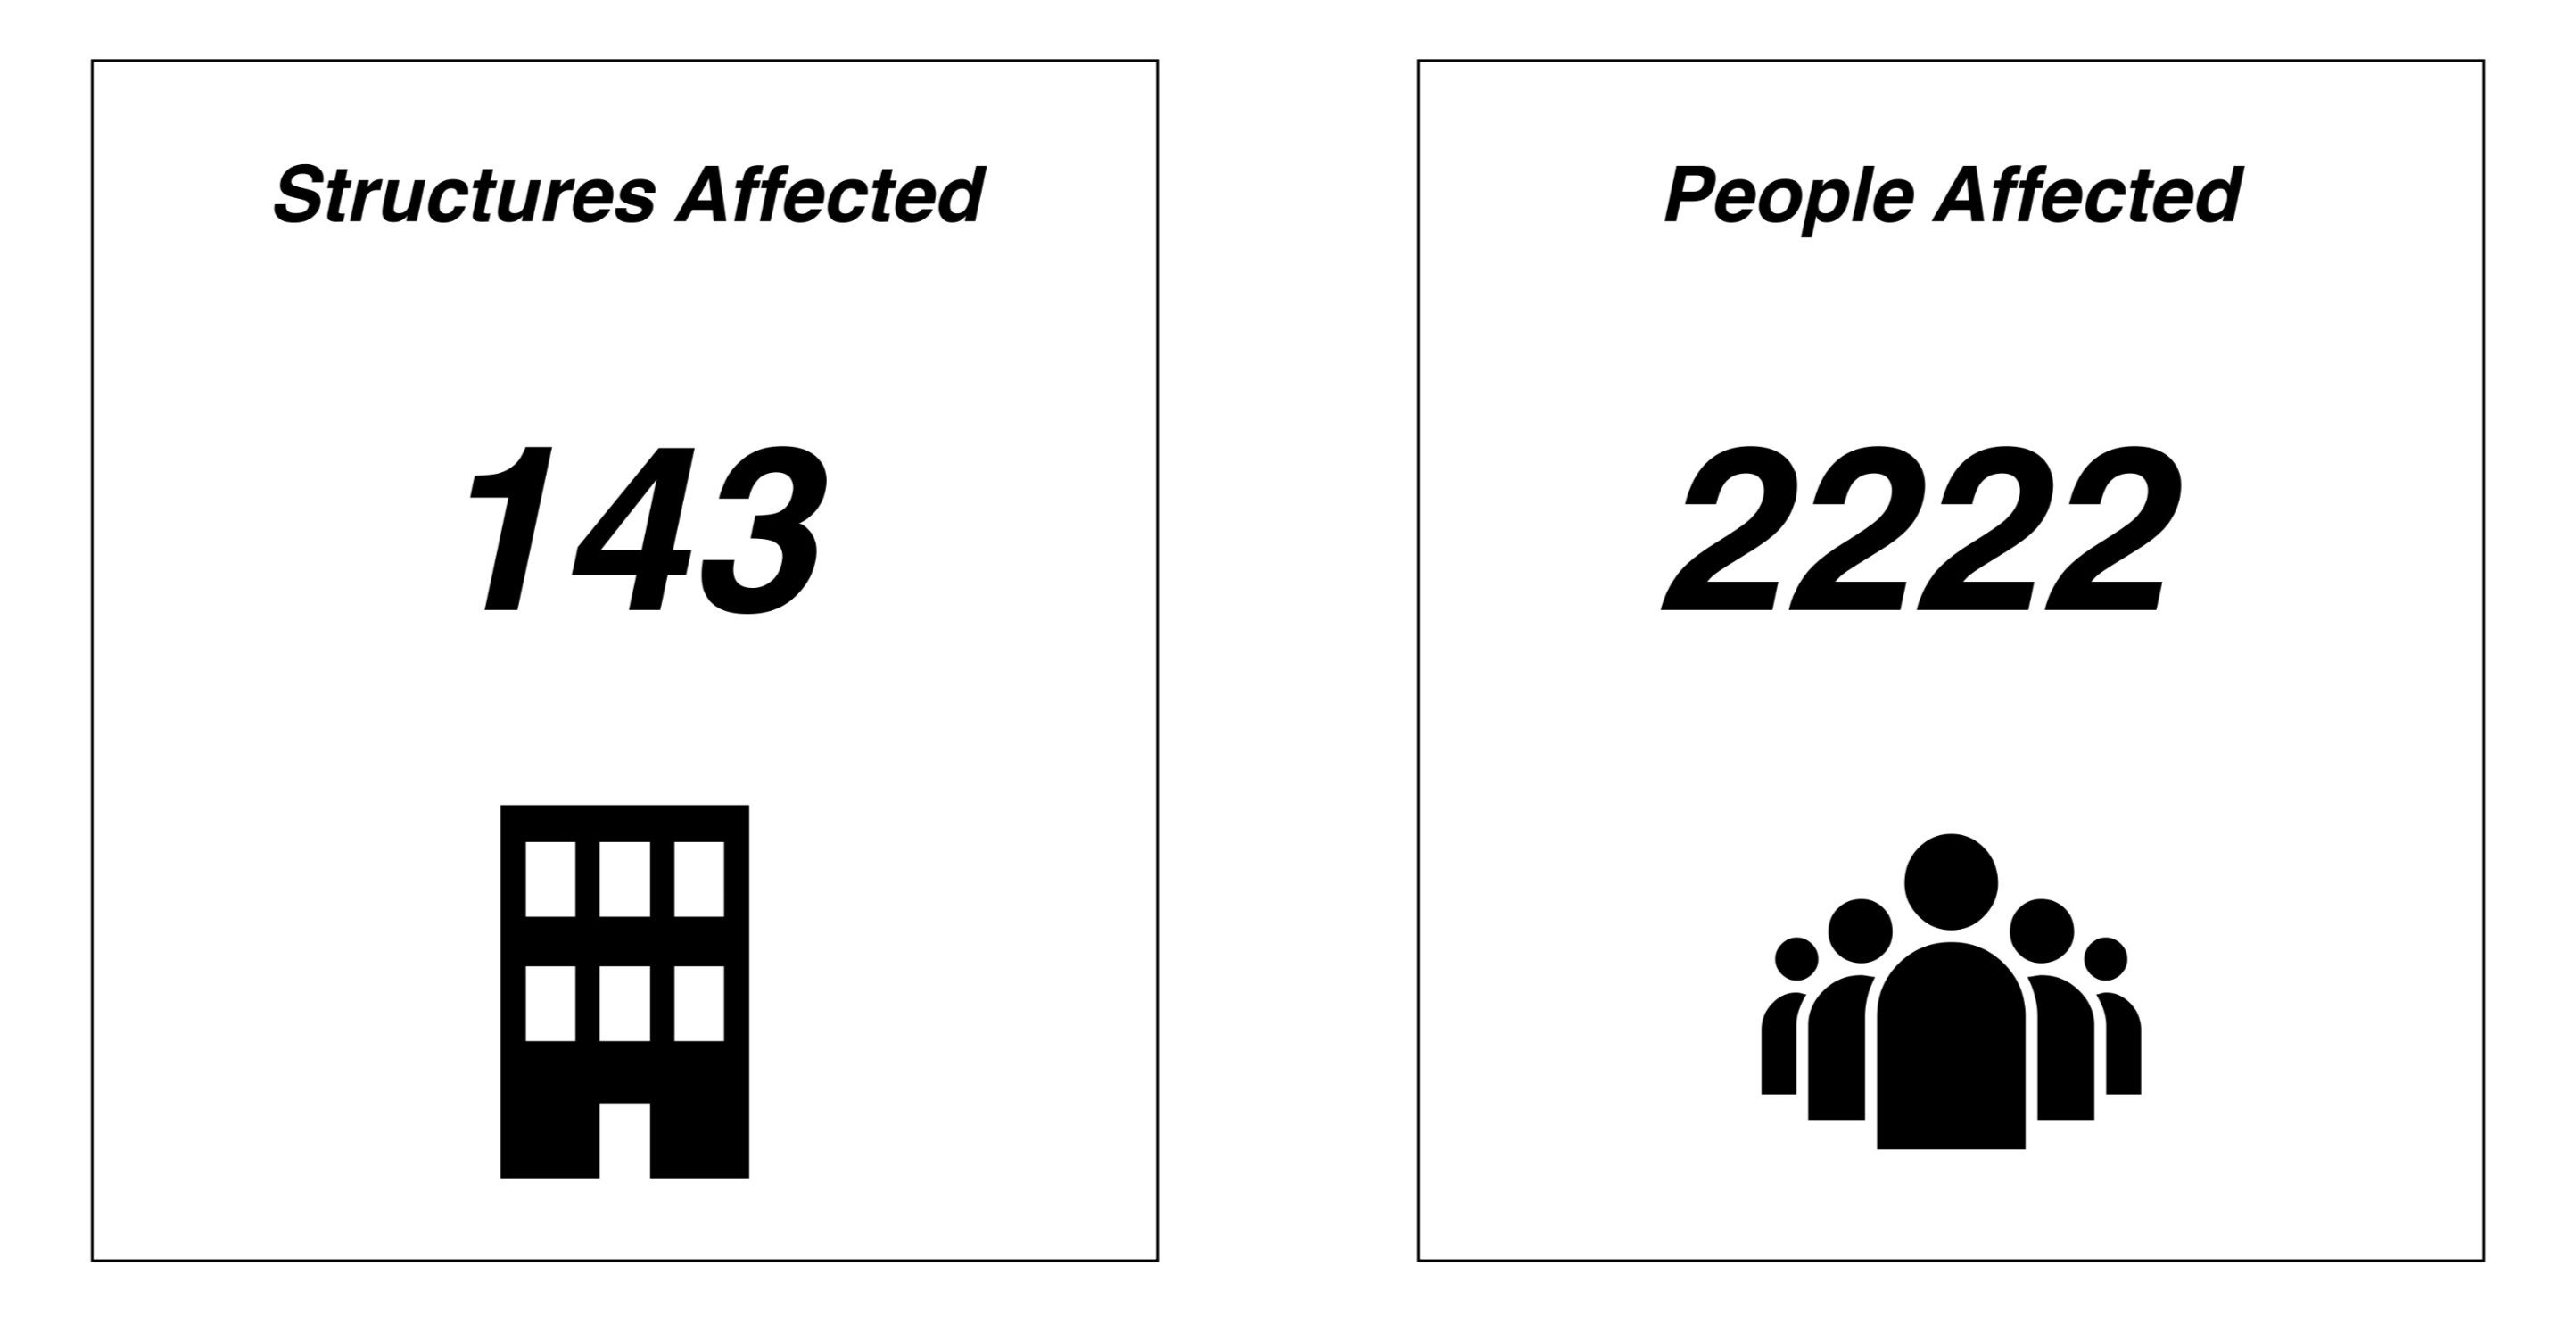
- Try to replicate the report shown below using the expressions provided in the analysis summary table below
| Name | Expectation |
|---|---|
Analysis |
Hazard: Floods |
Analysis |
Aggregation: Wards |
Analysis |
Population: People |
Analysis |
Structures: Buildings |
Reporting Options : Layers in the map report |
Analysis Summary - Flood Polygon on Structure Polygon |
Reporting Options : Layers in the map report |
Multi-exposure Flood Polygon on Structure Polygon, Population Raster |
Reporting Options : Layers in the map report |
Analysis Summary - Flood Polygon on Exposure Raster |
Reporting Options |
Layers in the map report : wards |
Reporting Options |
Layers in the map report : tandale_floods |
Report Template Structures Expression |
|
Report Template Population Expression |
|
More about multi-exposure in InaSAFE
In the expressions editor, there are a number of multi-exposure specific expressions in the InaSAFE - HTML Elements section. These can be used to provide the summaries for the different exposures used in the analysis.
You should note that only one of each exposure type is supported when doing a multi-exposure analysis. This means that you cannot, for example, use the tool to carry out an analysis of a flood on two different population exposure datasets.
The analysis outputs are arranged in nested QGIS layer groups if you do not specify custom reporting options in the multi-exposure dialog. If you do choose custom reporting options, the selected output layers will be provided in a single layer group for the multi-exposure analysis.
The templates developed in the multi-exposure tool can potentially be used in InaSAFE Realtime if carefully defined.

Check your knowledge:
-
InaSAFE supports multi-hazard analysis as well as multi-exposure analysis:
- True
- False
-
Indicate which are true::
- The multi-exposure tool is also used by InaSAFE Realtime
- You can use one or more of each exposure type
- InaSAFE will show all the outputs for multi-exposure analysis in a single QGIS layer group with nested sub-groups for each exposure type

Further reading:
-
See the InaSAFE Realtime website for some nice examples of the kind of report you can produce using InaSAFE multi-exposure http://realtime.inasafe.org
Download the sample data for the lesson.