

What is an impact?
“In this exercise we will look at the outputs produced by an InaSAFE analysis – impact layers, maps, summary tables and reports.”
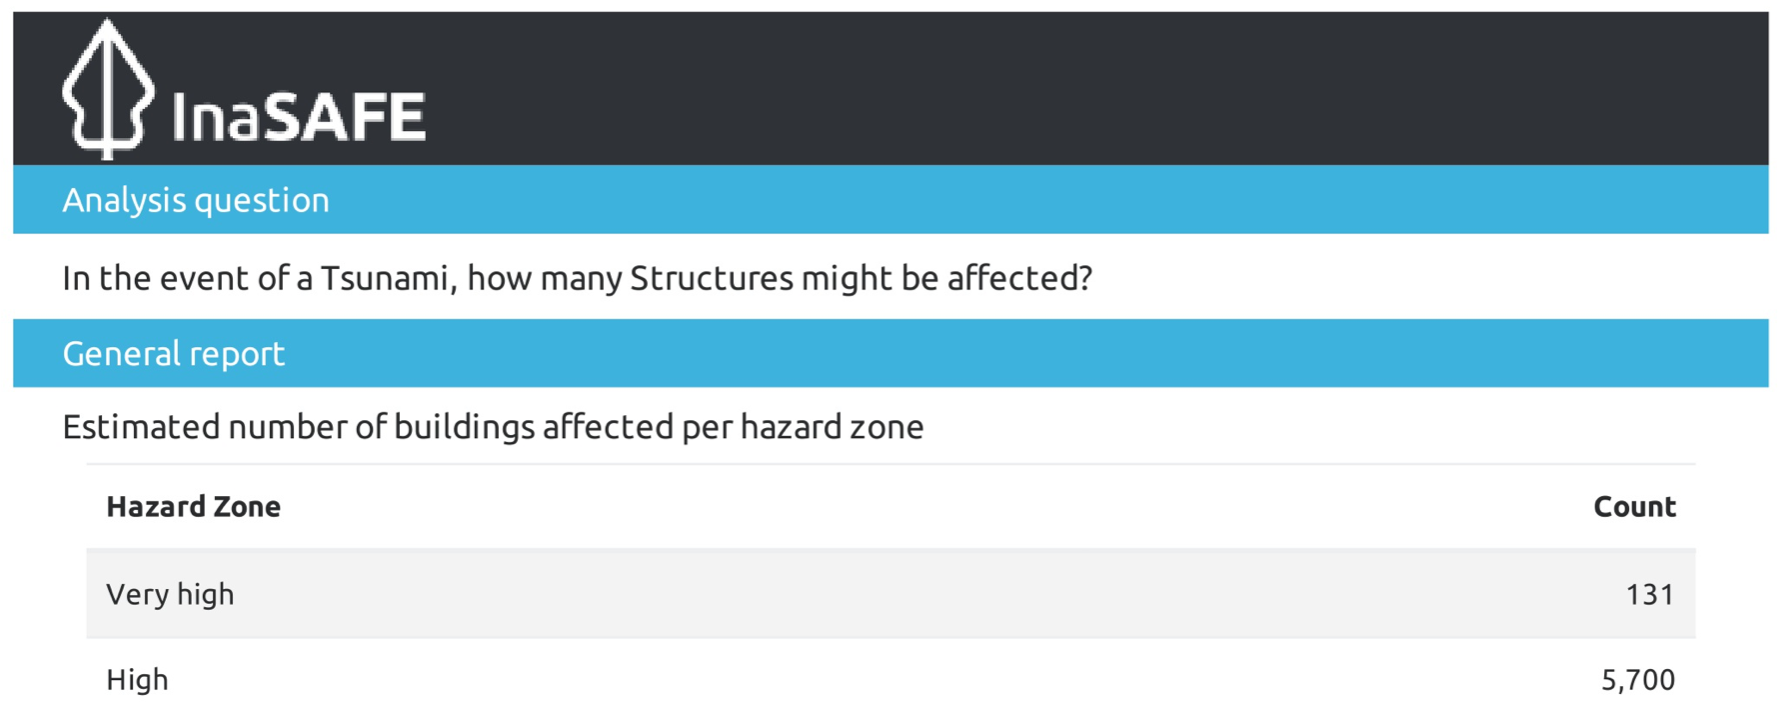
An impact layer is a new GIS dataset produced as the result of running an InaSAFE analysis. It will usually represent the exposure layer. For example, if you do your analysis on buildings, the impact layer output will be a buildings layer but each building will be classified according to the hazard level to which it was exposed. InaSAFE will typically apply its own symbology to the impact layer to make it clear which are the affected buildings. This is illustrated in the image above. InaSAFE also creates maps and reports that will help you to understand and communicate the estimated impact of the hazard.
You try:
Goal: Understand the purpose of impact reports.
Imagine there is a flood in your area. Form a small group of 4 people and work together to mock up a report on one or more sheets of paper which shows the effect of the flood on the buildings in your areas. The report could include map elements and tables / charts etc. If you are in need of inspiration, look at the word cloud below for some ideas.
Check your results:
Listen as the other groups report back their ideas – did you miss anything. How many of your ideas are actually practical / feasible?

More about
It should be noted that the impact layer will only include features / cells that occur within the analysis extent. All other features will be ‘clipped away’. It is very important to remember this when interpreting the impact summary (see section below) because the summary is only relevant to the analysis area.
Whereas the impact layer represents spatial data, the impact summary contains tabular and textual data. The impact summaries contain tables of the numbers of buildings, roads or people affected and include other textual information such as minimum needs breakdowns, action checklists, notes and assumptions, and so on. The impact summary presents the results of the InaSAFE analysis in an easy to digest form. Our expectation is that the numbers shown here would form part of your contingency planning process - typically as a starting point for discussion and planning on how to have sufficient resources in order to cater for the affected people, buildings or roads should a similar event to the one on which the scenario is based occur. The table below summarises the various outputs produced by InaSAFE (where E, H, A are Exposure, Hazard, Aggregation summaries respectively).
| Impact Product | Type | E | H | A | Details |
| Exposure summary | QGIS Vector Layer | Y | Y | Y | One row for each original exposure feature encoded with the hazard and aggregation areas it lies in (if any since hazard could be empty). |
| Aggregate hazard impacted | QGIS Vector Layer | N | Y | Y | One row for each aggregate hazard area (that is hazards chopped up by aggregation area). A count column is given for each exposure type providing the sum of all exposure features in that area. |
| Aggregate summary | "QGIS Vector | ||||
| Layer" | N | N | Y | One row for each aggregation area. A count column is given for each exposure type providing the sum of all affected exposure features in that aggregation area. | |
| Analysis impacted | QGIS Vector Layer | N | N | N | A single feature is provided in this layer. The attributes of this feature provide a count of affected exposure features per hazard class (regardless of exposure type). |
| Exposure summary table | QGIS Table | Y | N | N | This is a ‘pivot table’ where each row contains one exposure type and a column for each hazard class contains the count of exposure features. |
| Analysis log | QGIS Table | - | - | - | This provides technical details of the steps taken during the analysis. |
| Landscape report | PDF Map | - | - | - | This produces a printable PDF map of the analysis results in landscape A4 format. |
| Portrait report | PDF Map | - | - | - | This produces a printable PDF map of the analysis results in portrait A4 format. |
| Impact report | PDF Report | - | - | - | This provides a detailed summary of the analysis results including (aggregation) area by area breakdowns of demographics, minimum needs, features types etc. as needed. |
| Checklist report | PDF Report | - | - | - | This provides a list of notes and actions that a contingency planner should keep in mind whilst preparing their contingency plan, in the context of the impact report details. |
| Provenance report | Text Report | - | - | - | This provides details about the datasets used, parameters used, operating system environment etc. and is intended to be a way to ensure that an analysis is repeatable. |

Check your knowledge:
-
Indicate which are correct:
- Impact data produced by InaSAFE are made available as GeoSpatial datasets, excel spreadsheets, and word documents.
- Report data can only be used in QGIS.
- InaSAFE reports can only be modified by developers.
- There is no way to see what steps were taken during the analysis.