

Raster symbology in Context
“Raster symbology involves assigning colours to pixel values of an image”
This is so that they appear visible and you can easily differentiate between the pixels, thus making it easy to interpret the meaning of each pixel. In this module, we look at the various ways in which pixel values can be assigned colours. We will also briefly look at the properties of the raster and how raster can be blended with different colours so that we highlight particular features.
You try:
Goal: To learn to symbolise raster layers and generate DEM products on the fly.
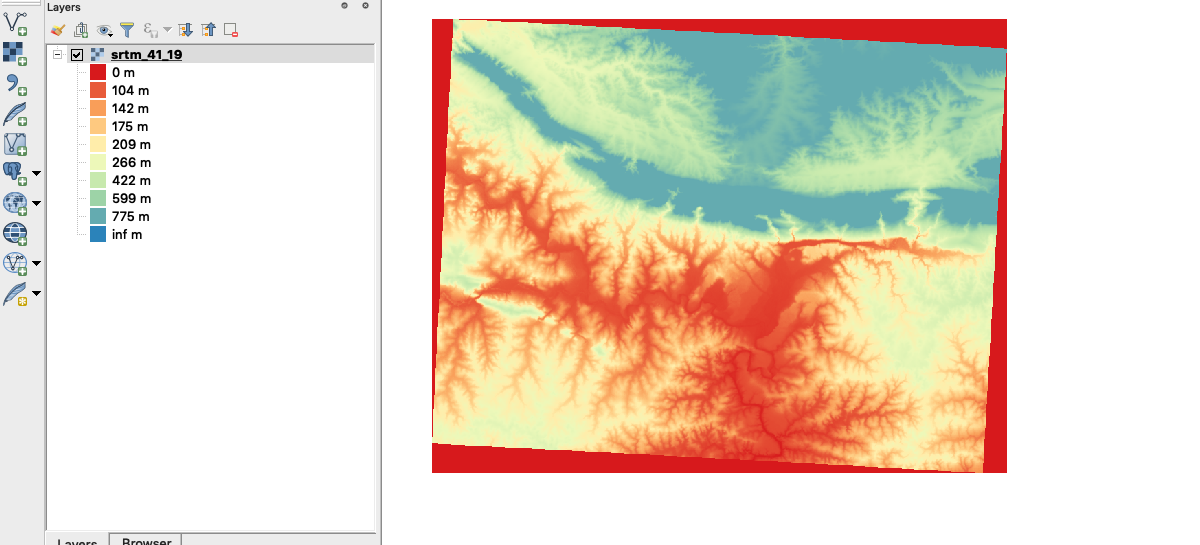
- Load the data exercise data into QGIS.
- Navigate to the properties of the raster and click on the histogram. Look at the pixel distribution and range.
- Navigate to the symbology section and choose the render type Unique Values. Classify your raster.
- Does your raster look nice.
- Symbolize the DEM layer according to the options specified below.
Which render type is best suited for styling the DEM layer you have loaded?
| Name | Expectation |
|---|---|
Render Type |
Pseudo-colour |
Color ramp |
Spectral but with Inverted colours |
Interpolation |
Linear |
Mode |
Quantile |
Classes |
10 |
Label Suffix |
m |
More about Raster symbology in Context
A raster image can be differentiated with the number of bands it consists of. They are single band image and multispectral images. The symbology of raster is usually determined by the number of bands it consists of. The range of pixels in a single band imagery is determined by the type of raster. It could be a DEM or DTM. QGIS has a range of renders that cater for symbolizing raster data ie Unique Values, Psuedo colour render, Hillshade
Multi-spectral images consist of 3 or more bands. These bands can be used to create a three-band colour composite also known as an RGB. Satellite imagery are a very good example of multispectral images.
When styling raster layers it is important to look at the range for the pixel values and have an understanding of what kind of data it represent so that your colour themes are meaningful.

Check your knowledge:
-
A Raster is:
- A musician who sings reggae.
- A type of GIS data where a pixel is used to represent a phenomenon on the earth surface
- Type of data that consist of point and polygons
-
What statement best describes the symbology or raster layers:
- Converting the pixel values into a human readable form
- A complex technique that allows raster to be drawn in a GIS
- Assigning pixels colour so that humans can easily understand what the data represents
-
Raster pixels range from 1 - 255 only:
- True
- False

Further reading:
Download the sample data for the lesson.