
Bhutan infrastructure damage planning
“In this lesson we will walk through the InaSAFE process from beginning to end using data local to Bhutan”
Scenario
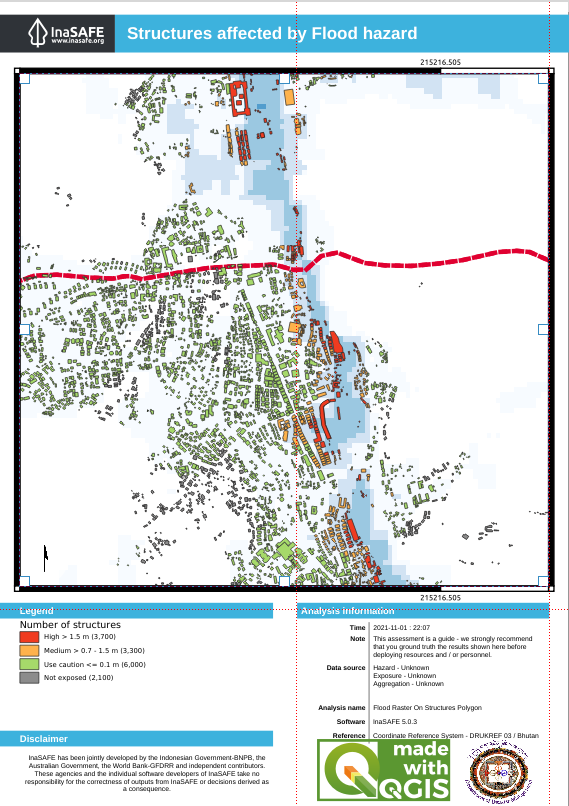
You are a disaster mitigation and management team. The government department responsible for infrastructure planning and maintenance has supplied you with flood susceptibility data and want to know overall which roads and buildings are most likely to be affected by flood damage aggregated by the given wards.
You try:
Goal: Your goal is to take the data provided and generate a custom report showing which roads and buildings will be most affected by flooding.
Exercise:
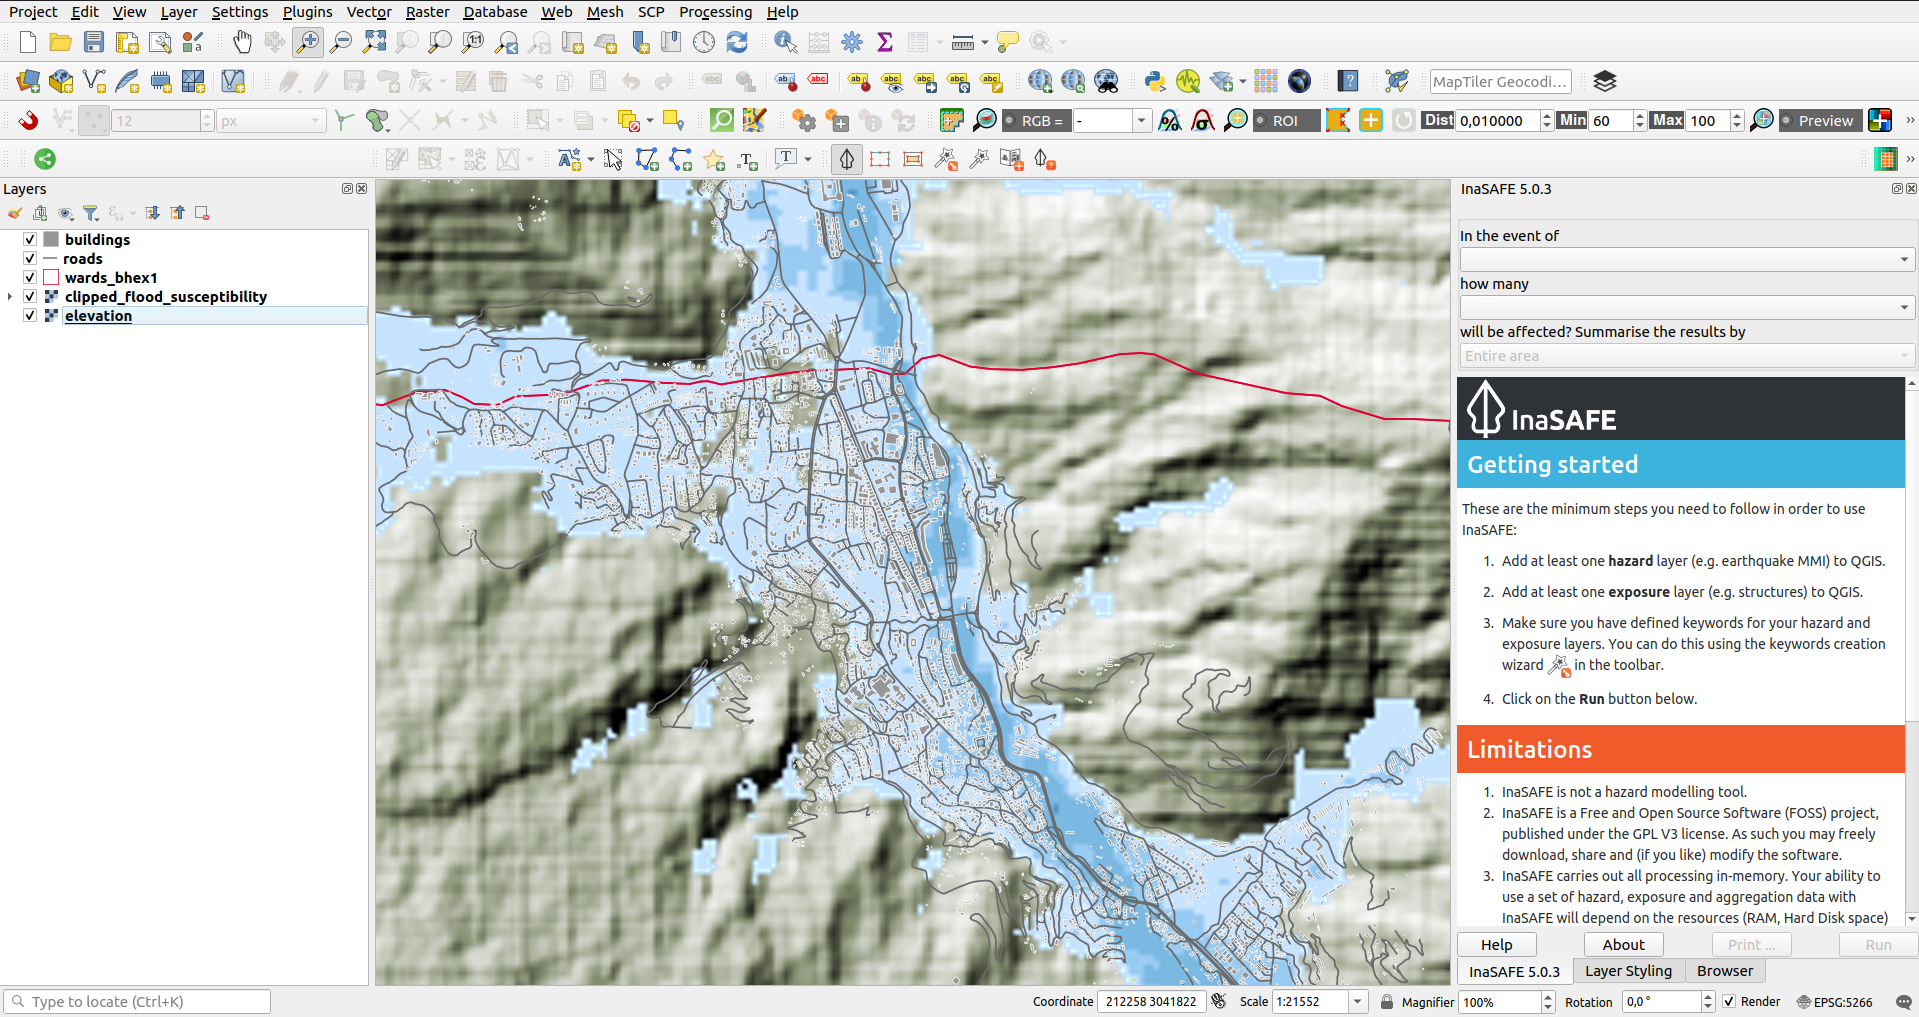
- load the exercise data layers and familiarise yourself with the data. i.e. look at the attribute tables and use the identify tool, pan and zoom etc.
*Run the Key word creation wizard for layers provided as per the table below and make your own informed decisions about the best keywords for each data type.
| Layer | Type | Classification |
|---|---|---|
| Flood susceptibility | Hazard | Flood classes high= 4&5, medium=2&3, low= 1, use caution=0 |
| Buildings | Exposure | OSM classes |
| Roads | Exposure | OSM classes on office |
| Wards | Aggregation | Gewog |
-
Run the Impact Function Centric Wizard tool for:
1) Flood on structures
2) Flood on roads -
Now run the Multi Exposure Analysis tool (plugins>InaSAFE>Multi Exposure Analysis) to do the same analysis but in one step.
-
Use the print button in the InaSafe dock and create a PDF report of the analysis.