

Bhutan human impact disaster mitigation
“In this lesson we will walk through the InaSAFE process from beginning to end using data local to Bhutan”
Scenario
The government department responsible for disaster impact management and humanitarian aid has approached you to generate information on the people who may be affected in flood susceptible areas.
You try:
Exercise:
-
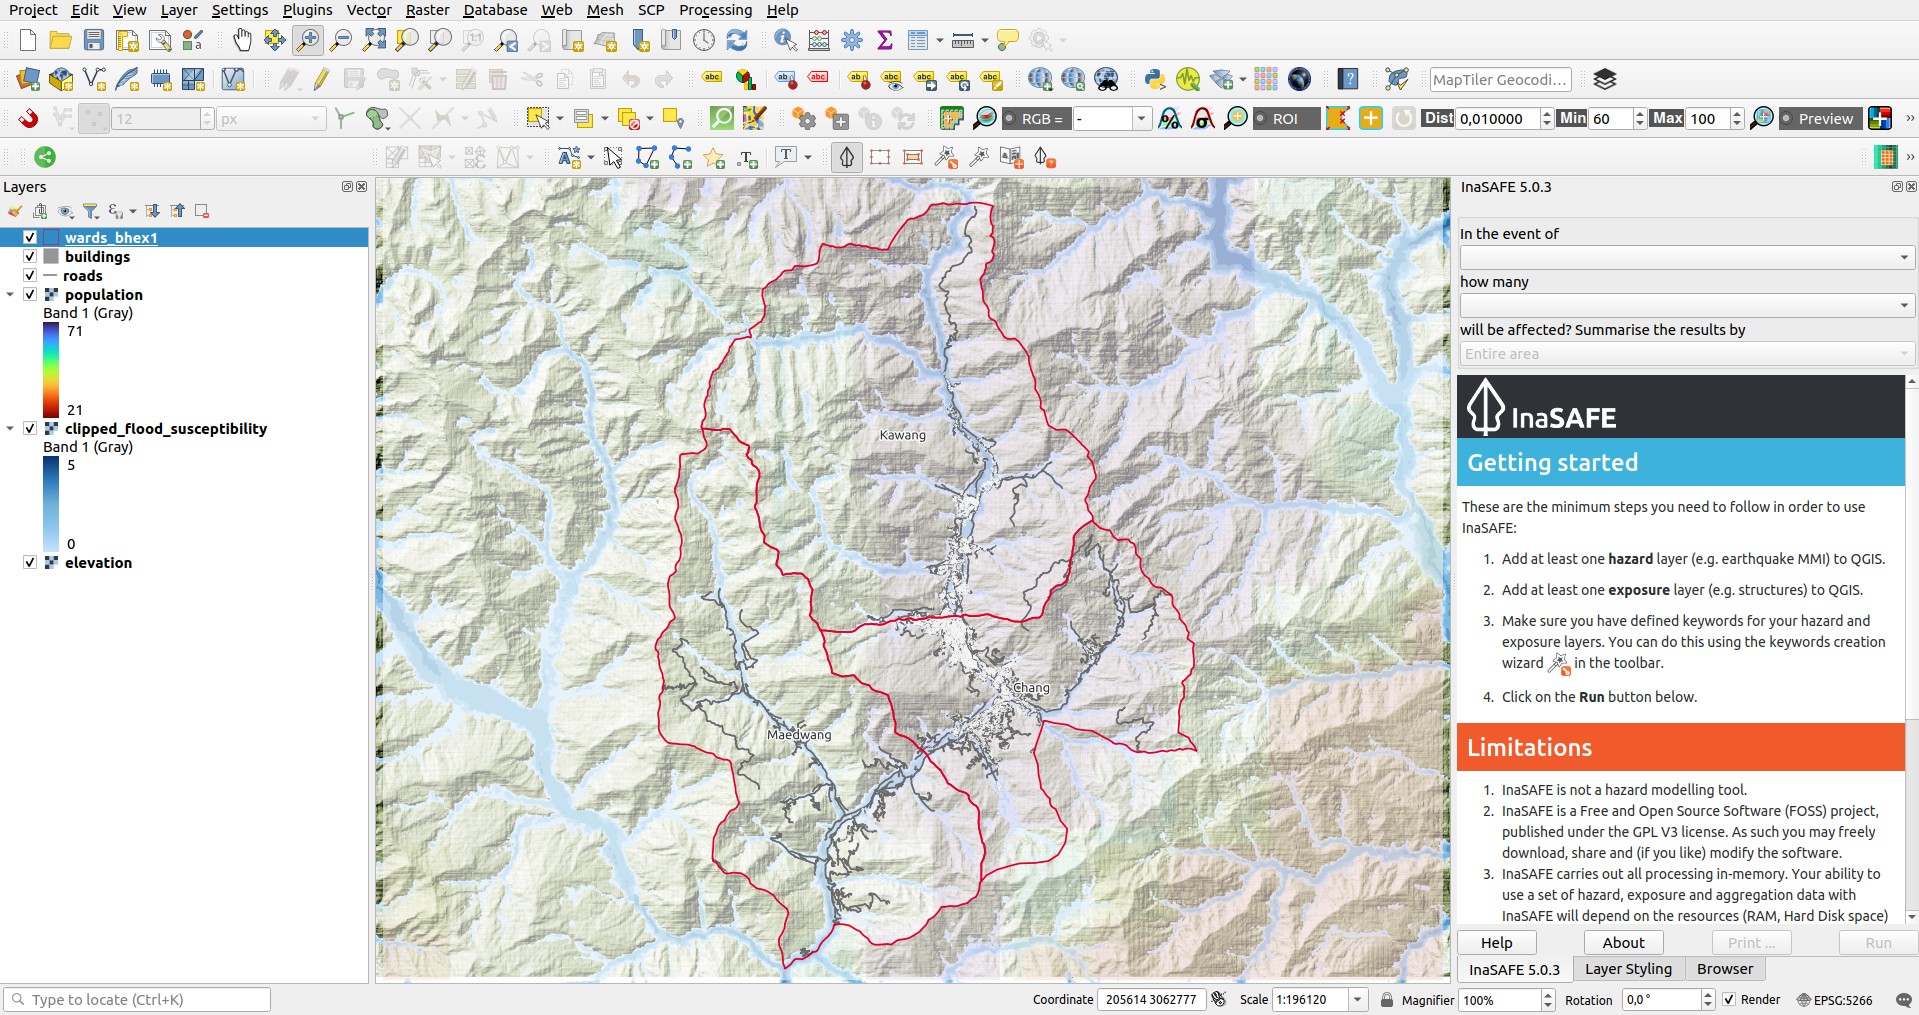
Load the flood susceptibility, population and wards layers and familiarise yourself with the data. i.e. look at the attribute tables and use the identify tool, pan and zoom etc.
-
Run the Key word creation wizard for layers provided as per the table below and make your own informed decisions about the best keywords for each data type.
| Layer | Type | Classification |
|---|---|---|
| Flood susceptibility | Hazard | Flood classes high= 4&5, medium=2&3, low= 1, use caution=0 |
| Wards | Aggregation | Gewog |
| Populations | Exposure | Continuous |
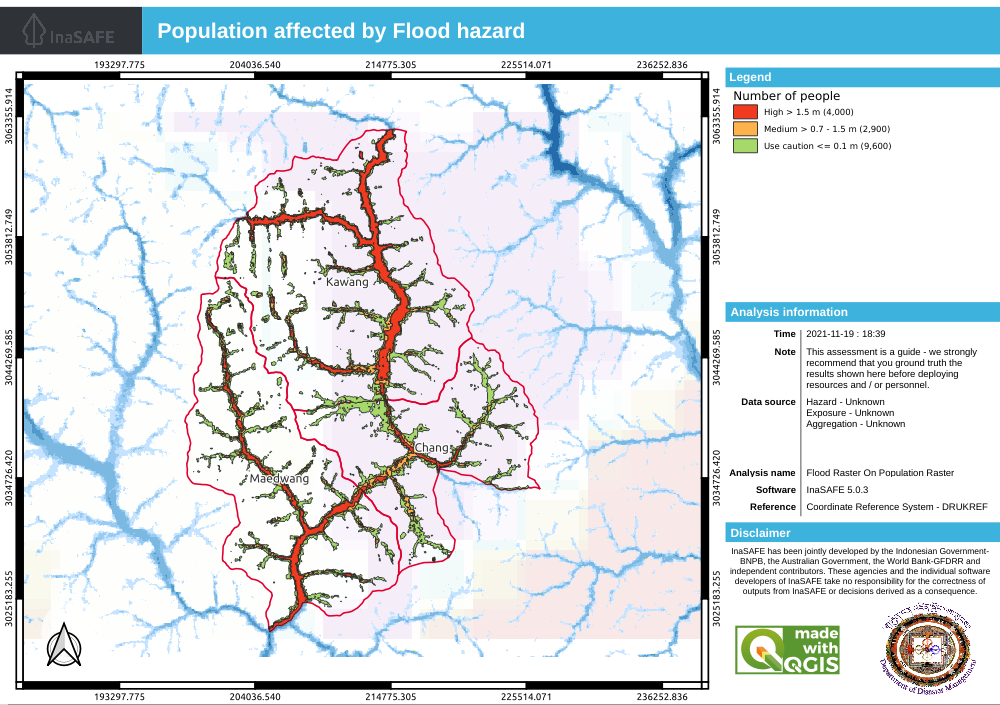
- Run the Impact Function Centric Wizard tool for Populations susceptible to flooding aggregated by Wards.
- In the final step of the Wizard choose to generate PFD reports on the output.
- Open and view the PDF on your system viewer.
More about
Optional Report Customisation
Experienced or QGIS superusers can customise the reports produced by InaSAFE using the layout designer.
Using the Print button on the InaSAFE docked panel open a report in the layout designer and generate a customised report as per the table below and using your own initiative to make the report effective and usable.
| Report element | Required |
|---|---|
| Orientation | portrait |
| North arrow | Choose from SVG options |
| Logos | upload your own or choose from QGIS options |
| Pages | 2 |
| Title box | [% @map_title %] - [% format_date( @start_datetime , 'dd MMMM yyyy')%] |
| HTML box 1 | [% inasafe_analysis_summary_field_value( 'displaced')%] |