

First steps – practical example (Bhutan)
“We are going to walk you through the process of running through an InaSAFE analysis in a very simple way.”
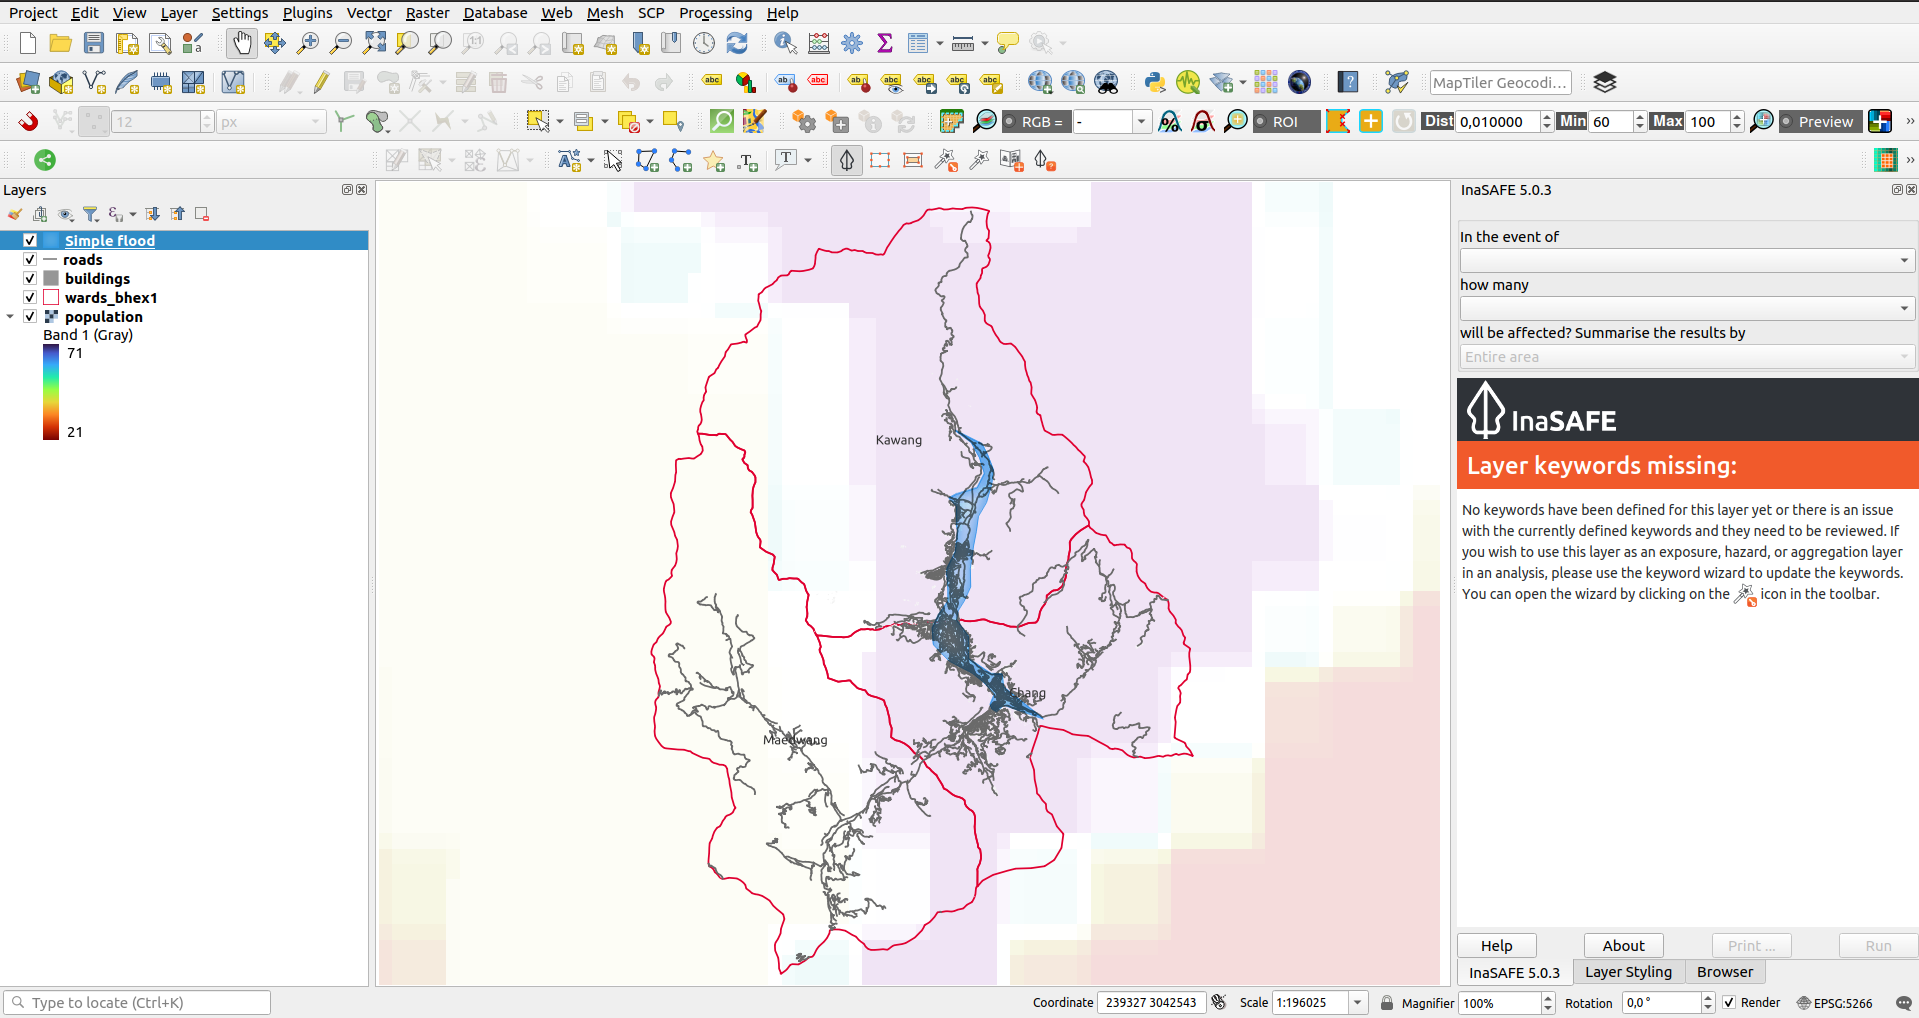
The analysis workflow in InaSAFE is similar regardless of which hazard and exposure types you have: Add your Hazard, Exposure and optionally Aggregation layers to QGIS, ensure they have their InaSAFE Keywords defined, then run the analysis. At the end of the analysis, InaSAFE will add a layer group to the layers panel, which will contain the GIS analysis results. InaSAFE will also generate PDF reports containing both maps and summary tables. We use a fictitious flood layer for this example.
Note that the data attached to this exercise includes the clipped data for this exercise and data for all of Bhutan.
You try:
-
Use the QGIS Browser panel to add the following datasets: wards.shp, Simple flood.shp, population.tif for analysis and the roads.shp, buildings.shp and elevation.tif for context from the data file attached to this lesson (remember to extract the data).
-
Select the population layer, then click the InaSAFE “Keywords Creation Wizard” icon in the InaSAFE toolbar (use the tooltips to ensure you click the right icon).
-
Use the InaSAFE Keywords Creation Wizard to define keywords for the population layer as follows: Layer= population, Purpose= Exposure, Exposure =Population, Geometry raster, Data type: Continuous, Units: count, Source :WorldPop, Url: http://worldpop.org.uk, Date: 25 Oct 2021
-
Use the InaSAFE Keywords Creation Wizard to define keywords for the Flood layer as follows: Hazard, Hazard type= Flood, Hazard scenario=Single event, Attribute value= Classified, Flood classes= Flood prone, Flood on population classification= Flood wet/dry classes (wet, yes). Click through the wizard and making sensible choices.
-
Finally run the InaSAFE ‘Impact Function Centric Wizard’, reading the instructions on each step carefully and make the most sensible choices (bearing in mind that all the data are already loaded in QGIS).
-
In the last step on the analysis choose to generate the PDF report of the impact and open them in the PDF viewer of your machine.
Check your results:
How many people were affected by the flood? Do the results match your expectations?
More about
In this exercise we have really simple datasets with only a few features so that we can easily understand all the results generated. We also pre-generated the keywords for the aggregation and hazard layers for you (we will cover these in detail in subsequent worksheets). So what happened when we ran the analysis? InaSAFE performed a sequence of spatial operations on the data, converting rasters to vector data, unioning each vector layer with all the others and assigning hazard and aggregation classes to each resulting feature.
The analysis results are then used to generate a number of reports using the InaSAFE reporting engine and the QGIS composer. The exact nature and sequence of operations will vary according to the input datasets; continuous raster data are reclassified then polygonised, vector attributes are remapped into standard exposure concepts and so on. For the report generation, InaSAFE rounds population numbers so you may notice that the sum of the results may seem inconsistent – this is not a mistake since we round up the results for each report element separately.